The Magic Triangle Of Validation
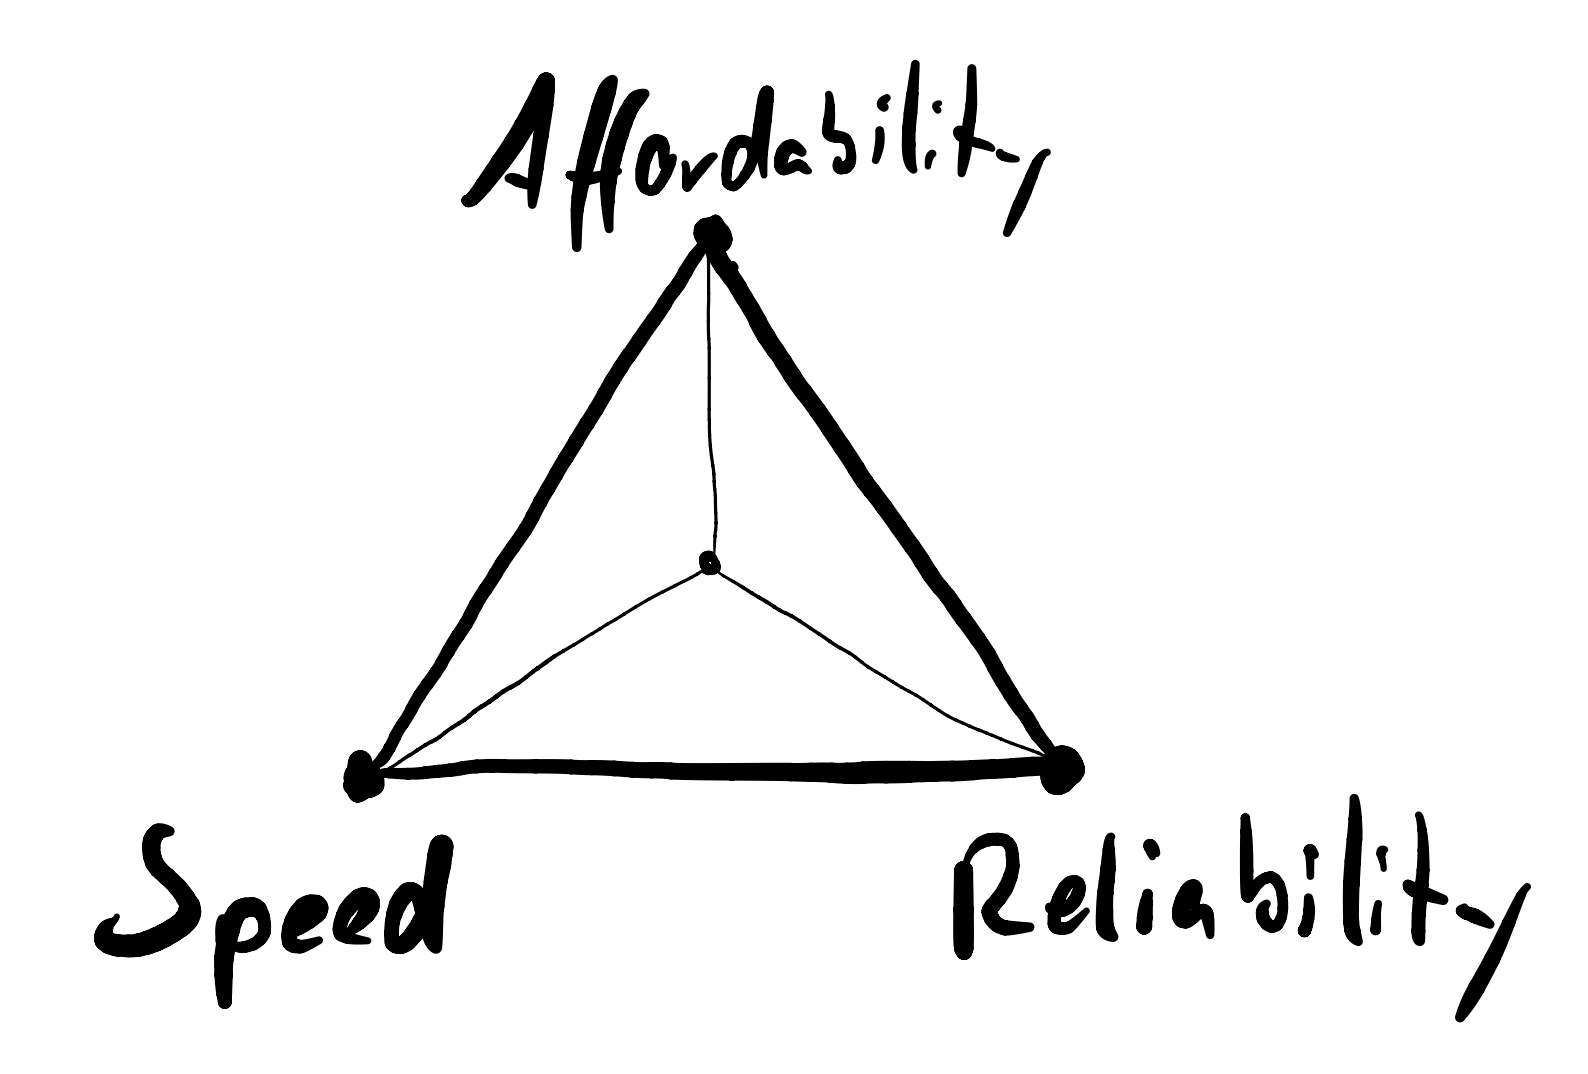
During our experiments, the team and I noticed that in validation, the parameters speed, affordability and reliability are usually at odds. In this post, I’ll explain what led us there and what that means.
Published November 7, 2021
If you’ve been building a service or product before, chances are you tried either quantitative or qualitative (or even both!) approaches to research your hypotheses. In an ideal world, these experiments yield highly reliable results in the fastest possible way and without spending a fortune (either in labor or cash).
But as you probably noticed already, this world is not ideal. For a couple of weeks now, the team and I invested quite a lot of time and money on a series of user research experiments. And we discovered that there seems to be a certain set of tradeoffs regarding those three aforementioned dimensions (affordability, speed and reliability) for most experiments, especially in the quantitative world. This reminded me dimly of any of those Magic Triangles so I coined this set of constraints the Magic Triangle Of Validation (and I don’t know... this somehow made me feel clever).
The decision for/against any of the dimensions is highly dependent on what you want to test and by sharing how we decided to change the focus from one to the other during our iterations, I want to give you some aid for your own experiments.
For this, I will briefly explain how we fixed our quantitative approach’s low reliability and high cost by deliberately deciding to reduce its speed. I will then contrast these findings with our experiences conducting interviews. Let’s dive in.
Spread Thin
The way we first started out with quantitative validation via LinkedIn is a very good way to demonstrate the triangle and was actually what pointed me towards it. In this approach, we constructed A/B/C/D tests for four different customer segments all at once. The goal was to identify both a way of communicating and a segment that works best for our services in a single experiment. But it turned out to be overly ambitious, because this effectively split our budget by 16 for every combination of ad and segment.
Since we were just starting out and therefore didn’t optimize our costs beforehand, the absolute number of interactions with each ad was so low to the point of being largely inconclusive. We set out to generate hard data but ultimately ended up with guess work. Yup! Great job.
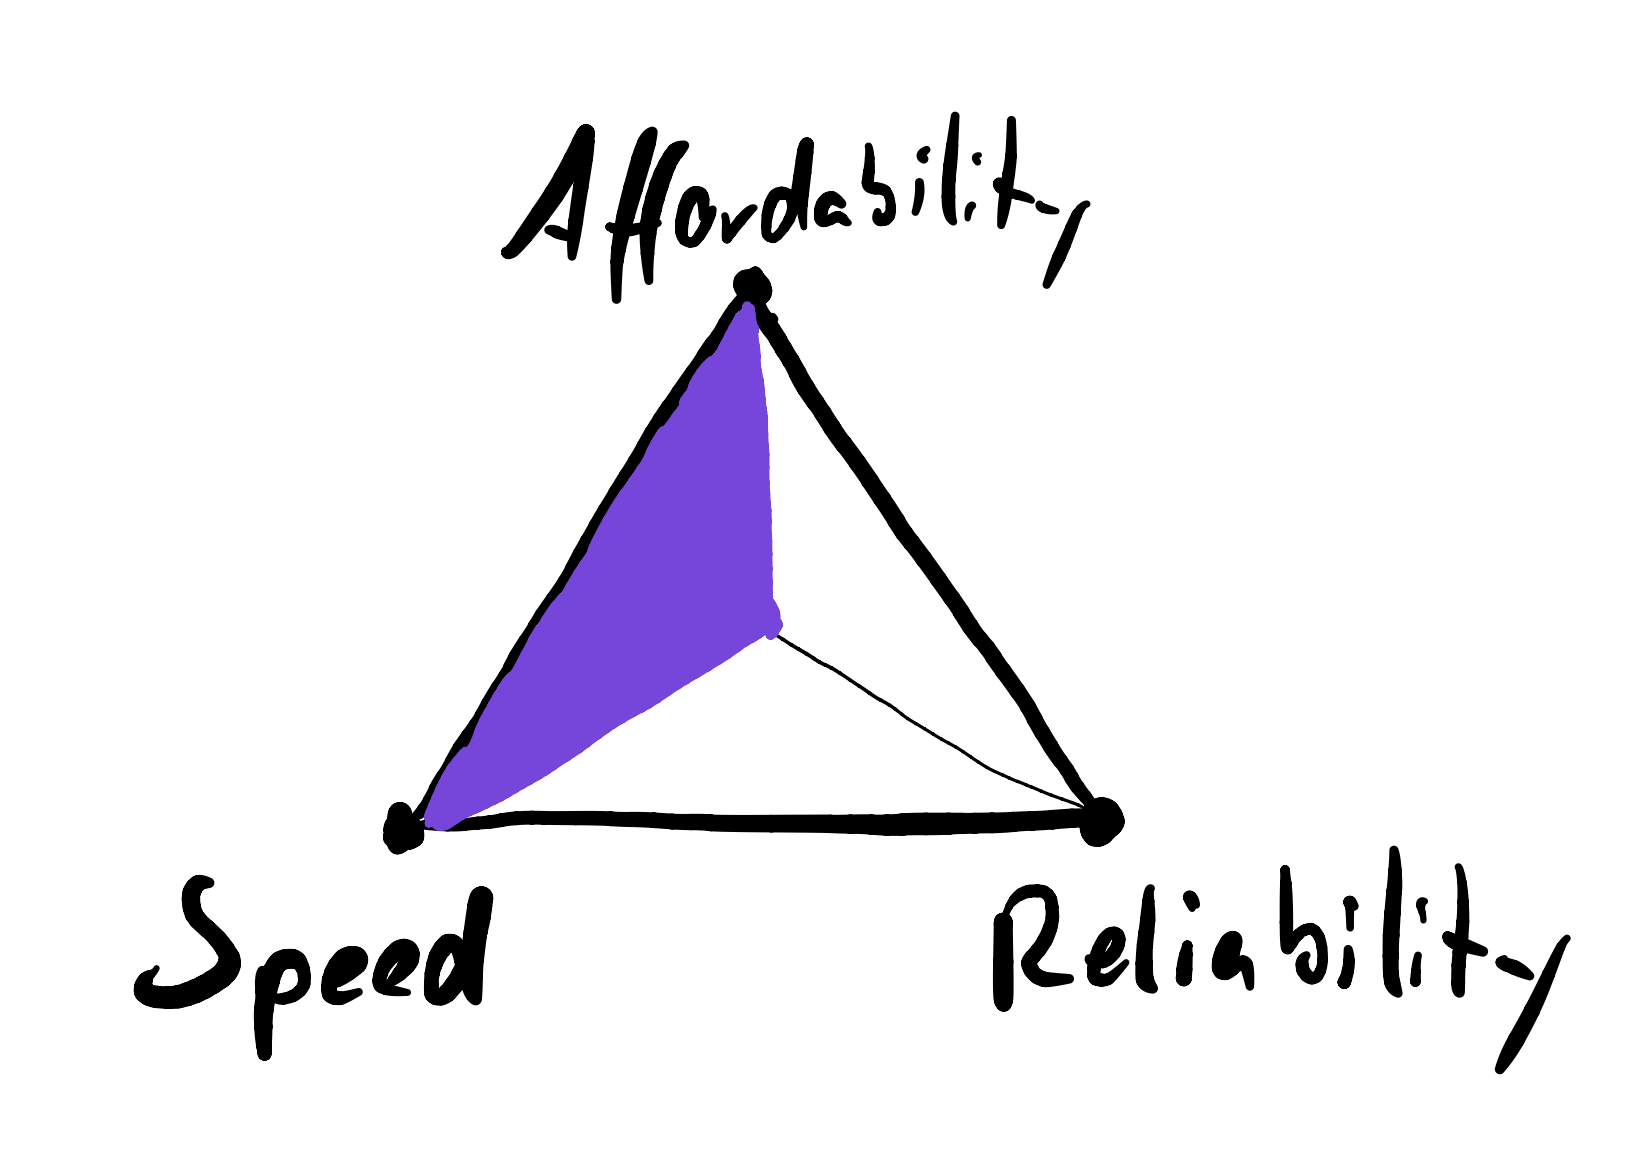
So what happened was that for our budget we optimized for speed (by testing 16 different combinations at once) and sacrificed reliability (because of the low absolute numbers per ad) by spreading it thin.
Focus
The big learning of this first round on LinkedIn was that we needed to tweak our approach. It was clear that we needed to first and foremost fix the reliability of the coming experiments, because with absolute numbers like this, we were basically wasting our time. At this point, there were two options:
- increase our ad spend for a higher amount of interactions overall and
- focus.
For getting meaningful results for all ads and segments, we’d have needed to increase the spending for the next iteration by a factor of 10. That was obviously not an option. But we were open to compromise on speed and decided to validate single aspects of our assumptions with a lower budget for a single target group.
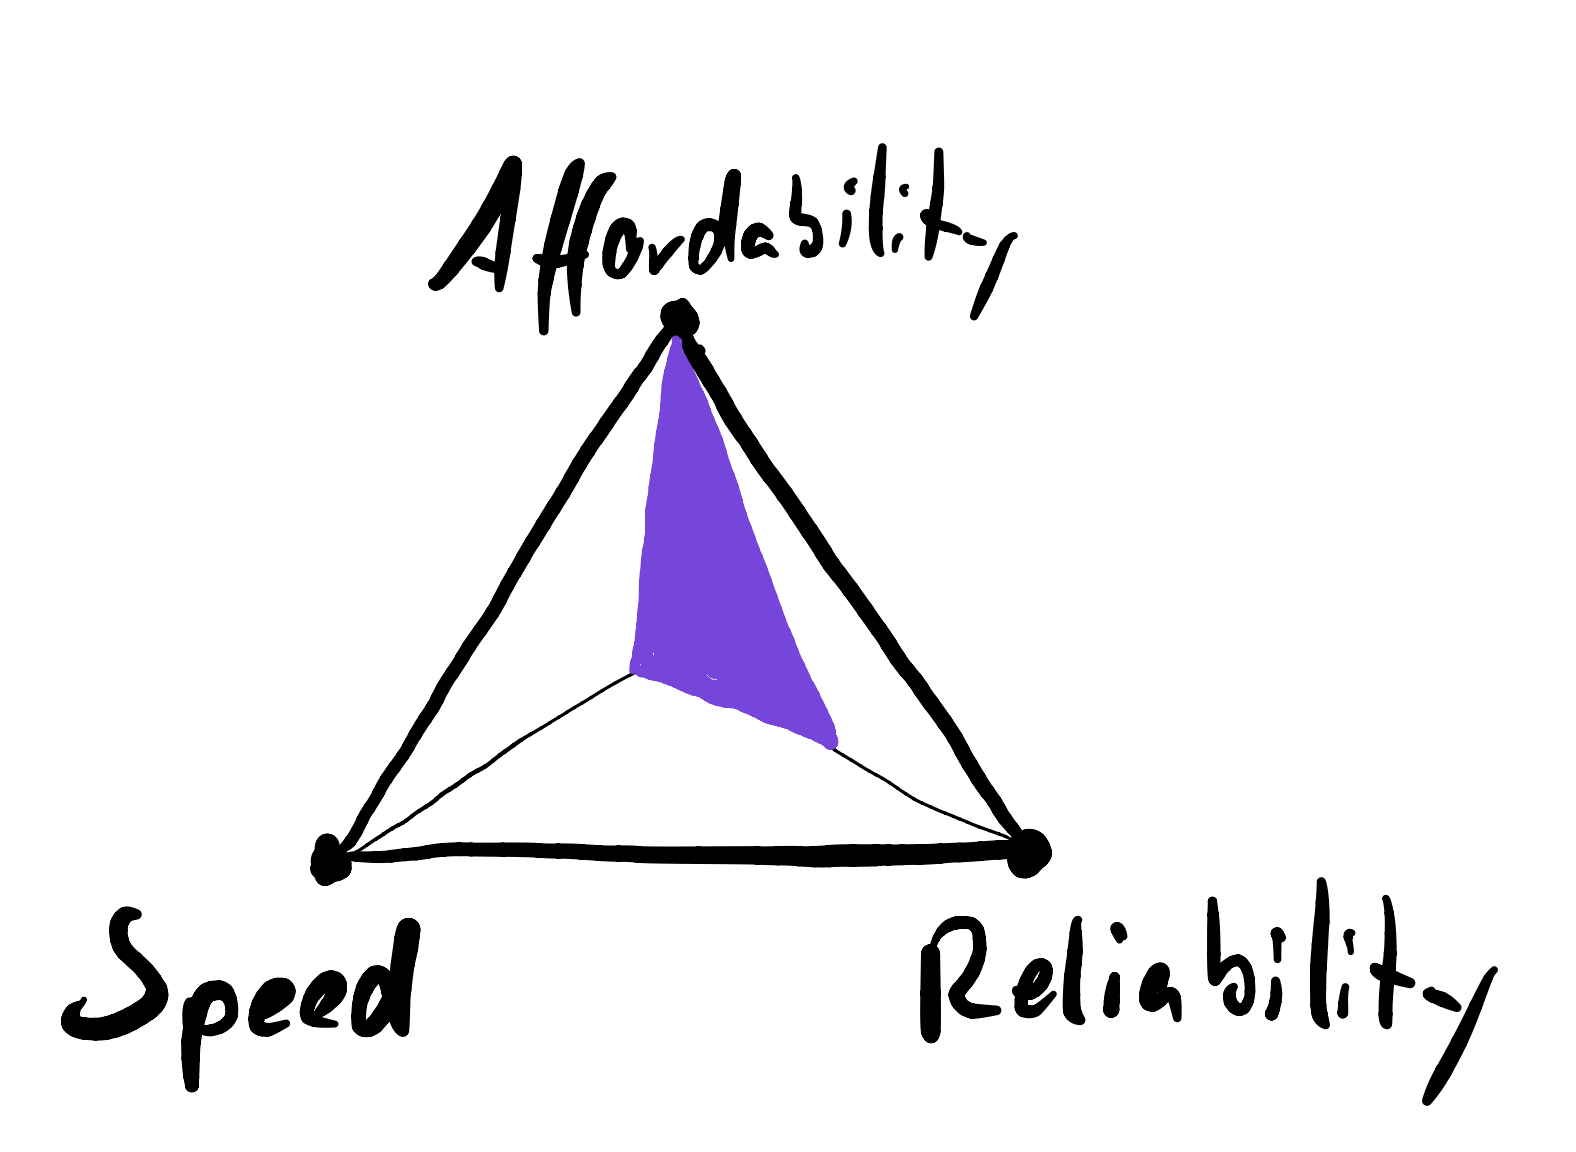
In terms of the triangle, by shifting from a spread-thin approach to a more targeted one, we moved up on affordability and reliability while at the same time moving down on the speed of our research process. A welcome side effect was that conducting tests with fewer variables (both less ads and less customer segments) enabled us to get a better feel for what worked and what didn’t. This led to dramatically (almost ten-fold) improving our ad metrics as well.
Y U NO INTERVIEW
I touched on the differences of more quantitative approaches from interviews in my last post already, so it makes sense to classify those according to the triangle here, too––especially, since they are so popular not only in the Lean world of product discovery.
In general it seems that interviews are a lot less subject to our control over the parameters. The cost of conducting an interview is almost always close to zero, but the acquisition and execution can be quite time-consuming, which is why conducting a series of interviews can take weeks.
Especially for B2B products and services (where incentives like vouchers are less fruitious) acquiring interview partners can be tedious. We primarily used LinkedIn and even though we automated the process of asking for interviews, it was everything but fast: The contacts are cold and the limit of 300 characters makes it hard to break this barrier.
But both speed and reliability underlie more variance. Especially for the latter, acceptable results can be produced with the right questions, a commitment (Advancement in Rob Fitzpatrick’s words, Skin In The Game in Alberto Savoia’s words) and a good fit between interviewee and customer segment.
Speed, on the other hand, is usually not so great. It generally takes a lot of time acquiring and scheduling interviews. This can be sped up through a good channel towards customers or a great network. Since we had neither, we had no choice but to invest the time pre-qualifying interview partners on LinkedIn to avoid interviews with people who don’t fit our target segment. This naturally slowed things down.
If you have access to a pool of fitting interview partners or a clear understanding where they can be found, speed can be enhanced. Narrowing that down is basically what Fitzpatrick suggests in The Mom Test when he talks about Slicing, but this may not always be applicable. For us, at least with our limited knowledge on the customer segment, it wasn’t.
Affordability, speed and reliability are decisive metrics
By explaining our LinkedIn and interview approaches, I’ve shown how the triangle works in practice. As seen, increasing the spending can increase speed, reliability or both: A series of reliable experiments takes time, but this can be remedied by higher costs. A single experiment with low absolute numbers is unreliable, but this, too, can be cured by parallelizing with a higher budget. Going both fast and reliable therefore takes an even bigger chunk of cash.
By now, we keep these three metrics in mind when conducting our tests. But we’re not the only ones who noticed their importance in product discovery. Alberto Savoia for example suggests optimizing pretotyping experiments for the metrics hours-to-data and dollars-to-data while treating reliability as a given. Alex Osterwalder et al. include Test Cost, Data Reliability and Time Required on their Test Cards, as well.
So while the importance of these metrics is recognized, I hope it may help to view them as trade-offs between each other and visualize them as a triangle.

Timothy Krechel
Innovation Consultant
Subscribe to my product journey.
